Introduction
Discover how technical analysis empowers traders to analyze price movements of Google using tools like charts, patterns, trends, and signals. Uncover the dominant trend's direction, strength, and duration, along with potential entry and exit points. Learn risk management techniques such as stop-loss orders, profit targets, position sizing, and leverage. Combine technical analysis with fundamental and market analysis for a comprehensive understanding of an asset's performance.
Overview of Google Stock and its recent performance
Google stock refers to the shares of Alphabet Inc. (NASDAQ: GOOG, NASDAQ: GOOGL), the parent company of Google LLC, the world's largest online search engine and digital advertising platform. Alphabet Inc. is one of the largest and most valuable companies globally, with a market capitalization exceeding $1.5 trillion as of June 23, 2023. The company operates through four business segments: Google Services, Google Cloud, Other Bets, and Hedging Activities. Google Services generates revenue from advertising and includes products like Google Search, YouTube, Gmail, Google Maps, Google Play, Chrome, Android, and others. Google Cloud provides cloud computing, data analytics, AI, ML, and enterprise solutions to customers in various industries.
Other Bets encompasses businesses outside of Google's core operations, such as Waymo, Verily, Calico, Loon, Wing, and more. Hedging Activities involve financial instruments used to manage foreign exchange risk. Google stock is favored by traders and investors due to its strong financial performance, growth potential, and competitive advantage.
The company consistently exceeds revenue and earnings expectations while expanding its product portfolio, customer base, and market share. Benefiting from digitalization, cloud computing, AI, ML, and online advertising trends, Google stock experiences high demand across different sectors. Recently, the stock reached an all-time high of $2,431.38 per share on June 22, 2023, with a one-year return of 40.83% and impressive long-term performance metrics as of June 23, 2023: 3-Year Return: 116.72%, 5-Year Return: 238.71%, 10-Year Return: 1,005.35%.

Source: TradingView
Price action and trend of Google stock
Price action refers to the movement of an asset's price over time, reflecting supply and demand dynamics in the market. It is a valuable tool for identifying the dominant trend's direction, strength, and duration, as well as potential entry and exit points for trading.

Trend, on the other hand, characterizes the general direction of an asset's price movement over a specific period. There are three main types of trends: uptrend, downtrend, and sideways trend. An uptrend occurs when the price forms higher highs and higher lows, while a downtrend is marked by lower highs and lower lows. A sideways trend indicates a price range without a clear upward or downward movement.
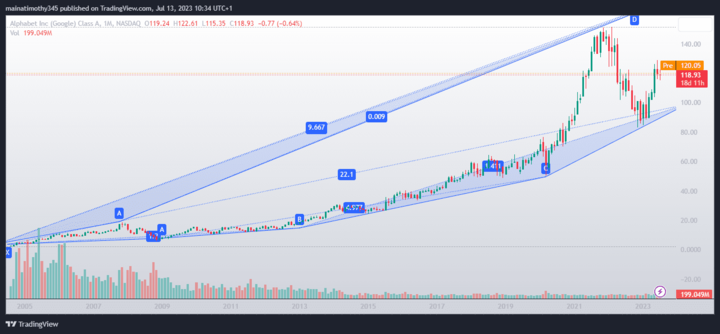
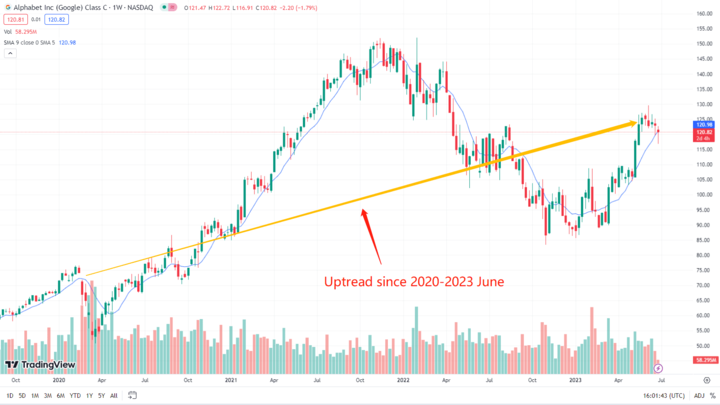
Analyzing the historical price action of Google stock, it has predominantly traded in an uptrend since its IPO in 2004, consistently reaching new highs. However, the stock has also experienced periods of consolidation and correction, resulting in intermediate downtrends and sideways trends within the overarching uptrend.
Source: TradingView
Several potential catalysts can significantly impact the price of Google stock by influencing market supply and demand. Macroeconomic trends, such as global trade tensions and interest rate changes, can affect overall market sentiment and demand for Google's products and services. For instance, trade wars or tariffs may disrupt Google's global supply chain or restrict access to foreign markets, while interest rate hikes or cuts can impact borrowing costs and consumer spending power.
Industry-specific news is another factor that can influence Google stock. Changes in government regulations or new product launches from competitors may alter Google's competitive position and market share. Antitrust investigations or lawsuits can limit Google's market power and result in fines or penalties, while innovative products or features from competitors like Facebook (FB), Amazon (AMZN), Apple (AAPL), or Microsoft (MSFT) can pose challenges to Google's dominance and innovation.
Furthermore, company-specific events such as earnings reports or management changes can have a significant impact on Google's financial performance and growth prospects. Positive or negative earnings surprises can boost or harm the stock price, while shifts in leadership or strategy can indicate new opportunities or challenges for the company.
Considering these factors and their potential influence, traders and investors closely monitor price action and remain attentive to news and events that could impact Google stock's performance.
Key technical indicators of Google stock
Technical indicators are mathematical calculations based on an asset's price and/or volume data, providing additional information about its price action and trend. These indicators assist traders in confirming, predicting, or signalling the direction, strength, duration, and potential reversal of an asset's price movement. They also help identify potential entry and exit points for trading and enable risk and reward management through techniques like stop-loss orders, profit targets, position sizing, and leverage.
There are various types of technical indicators, including trend indicators, momentum indicators, volatility indicators, volume indicators, and others. Each type serves a different purpose and function, and traders can combine multiple indicators to enhance their analysis and decision-making process. However, it's essential to be aware of the limitations and drawbacks of technical indicators, such as lagging indicators, false signals, and overfitting.
In this section, we will introduce some key technical indicators for analyzing Google stock and how to use them in trading. The following technical indicators will be covered:
-Moving Averages: Moving averages smooth out price data over a specified period, providing a trend-following indicator that helps identify support and resistance levels.
-Relative Strength Index (RSI): The RSI measures the magnitude and speed of price changes, indicating overbought or oversold conditions and potential trend reversals.
-Bollinger Bands: Bollinger Bands consist of a moving average with upper and lower bands that dynamically expand and contract based on market volatility, helping traders identify price volatility and potential breakout points.
-Moving Average Convergence Divergence (MACD): The MACD calculates the difference between two moving averages, providing a trend-following momentum indicator that helps identify potential buy and sell signals.
Relative strength index (RSI)
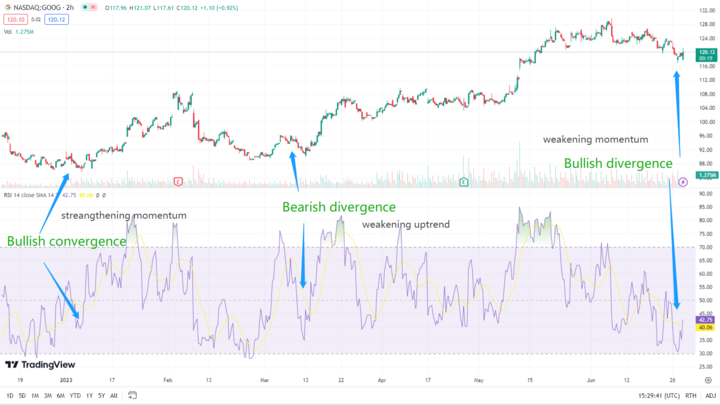
We will use the 14-day RSI (purple line) with the default thresholds of 70 and 30. We will also use the candlestick chart to show the price action of Google stock from April 2020 to June 2023. As shown in the chart below, Google stock has been trading in an uptrend since March 2020, as indicated by the rising price and the RSI staying above 50 most of the time. The RSI has also been forming some patterns that signal potential price movements. Some examples are:
Source: TradingView
● Bullish divergence: In June 2023, the price made a lower low while the RSI made a higher low, indicating a weakening downtrend or momentum. This was followed by a bullish crossover of the RSI above 50 and a reversal of the price to resume its uptrend.
● Bearish divergence: In March 2023, the price made a higher high while the RSI made a lower high, indicating a weakening uptrend or momentum. This was followed by a bearish crossover of the RSI below 50 and a correction of the price to test its support level.
● Bullish convergence: In January 2023, the price made a higher low while the RSI made a higher low, indicating a strengthening uptrend or momentum. This was followed by a bullish crossover of the RSI above 50 and a breakout of the price to reach new highs. Some potential entry points for buying Google stock are when the RSI crosses above 50 or bounces off an oversold level (below 30), indicating an uptrend or momentum. Some potential exit points for selling Google stock are when the RSI crosses below 50 or bounces off an overbought level (above 70), indicating a downtrend or momentum. Alternatively, traders can use trailing stops or profit targets to lock in their profits or limit their losses.
Bollinger Bands
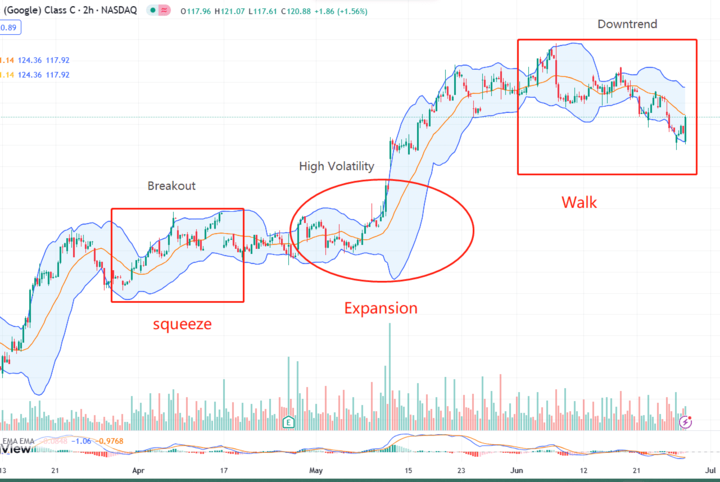
We will use the 20-day SMA (blue line) and two standard deviations for the Bollinger Bands (red lines). We will also use the candlestick chart to show the price action of Google stock from April 2020 to June 2023. As shown in the chart below, Google stock has been trading within the Bollinger Bands most of the time, indicating normal volatility and price movement. The Bollinger Bands have also been forming some patterns that signal potential price movements. Some examples are:
Source: TradingView
● Squeeze: In April 2023, the Bollinger Bands squeezed and converged, indicating low volatility and a potential breakout. This was followed by a bullish breakout of the price above the upper band and a continuation of the uptrend.
● Expansion: In May 2023, the Bollinger Bands expanded and diverged, indicating high volatility and a potential trend reversal. This was followed by a bearish reversal of the price below the lower band and a correction of the uptrend.
● Walk: In June 2023, the price walked along the lower band, indicating a strong downtrend and momentum in the downward direction. This was followed by a breakdown of the price below the support level and a further decline. Some potential entry points for buying Google stock are when the price breaks above the upper band or bounces off the middle or lower band, indicating an uptrend or momentum. Some potential exit points for selling Google stock are when the price breaks below the lower band or bounces off the middle or upper band, indicating a downtrend or momentum. Alternatively, traders can use trailing stops or profit targets to lock in their profits or limit their losses.
MACD (Moving Average Convergence Divergence)
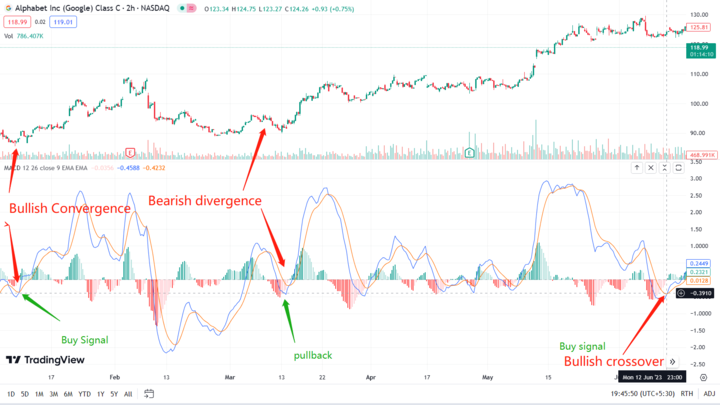
We will use the default settings for the MACD indicator: a 12-period EMA (blue line), a 26-period EMA (red line), and a 9-period EMA (green line). We will also use a candlestick chart to show the price action of Google stock from April 2020 to June 2023. As shown in the chart below, Google stock has been following the signals of the MACD indicator most of the time, indicating its usefulness and reliability for trading Google stock. The MACD indicator has also been forming some patterns that signal potential price movements. Here are some examples:
Source: TradingView
● Bullish crossover: In June 2023, the MACD line crossed above the signal line, indicating an uptrend or a potential buy signal. This was confirmed by a positive zero-line cross and a rising histogram. It was followed by a breakout in Google stock above its previous resistance level.
● Bearish divergence: In March 2023, Google stock made a higher high while the MACD made a lower high, indicating a weakening uptrend or momentum. This was followed by a bearish crossover of the MACD below the signal line, a negative zero-line cross, and a falling histogram. It was followed by a pullback in Google stock to test its support level.
● Bullish convergence: In January 2023, Google stock made a lower low while the MACD made a higher low, indicating a strengthening uptrend or momentum. This was followed by a bullish crossover of the MACD above the signal line and a positive zero-line cross, indicating a potential buy signal.
Moving averages
We will use three EMAs with different lengths: a 50-day EMA (blue line), a 100-day EMA (red line), and a 200-day EMA (green line). We will also use a candlestick chart to show the price action of Google stock from April 2020 to June 2023.
As shown in the chart below, Google stock has been trading in an uptrend since March 2020, as indicated by the bullish crossovers of the EMAs and the price staying above the EMAs most of the time. The EMAs have also been fanning out, indicating a strong trend and momentum in the upward direction.
Some potential entry points for buying Google stock are when the price pulls back to or bounces off one of the EMAs, especially the 50-day EMA or the 100-day EMA, which act as dynamic support levels for the price.
Some potential exit points for selling Google stock are when the price breaks below one of the EMAs, especially the 50-day EMA or the 100-day EMA, which act as dynamic resistance levels for the price. Alternatively, traders can use trailing stops or profit targets to lock in their profits or limit their losses.
Source: TradingView
How to use chart patterns to identify potential trading opportunities for Google stock
Chart patterns are formations or shapes that appear on the price chart of an asset, reflecting the psychology and behavior of market participants. These patterns can help traders identify potential trend reversals, price breakouts, and entry and exit points for trading. There are different types of chart patterns, including reversal patterns, continuation patterns, and bilateral patterns. Reversal patterns indicate a change in the trend's direction, such as head and shoulders, double tops, or double bottoms. Continuation patterns suggest a pause or consolidation in the trend, followed by its resumption, such as triangles and flags. Bilateral patterns indicate a period of uncertainty or indecision in the market, which is usually followed by a breakout in either direction, such as wedges and rectangles.
Traders can use chart patterns in conjunction with other technical indicators and tools, such as trend lines, support/resistance levels, volume, and signals, to confirm, predict, or signal the direction, strength, duration, and potential reversal of an asset's price movement. They can also use chart patterns to set risk and reward parameters, including stop-loss orders, profit targets, position sizing, and leverage.
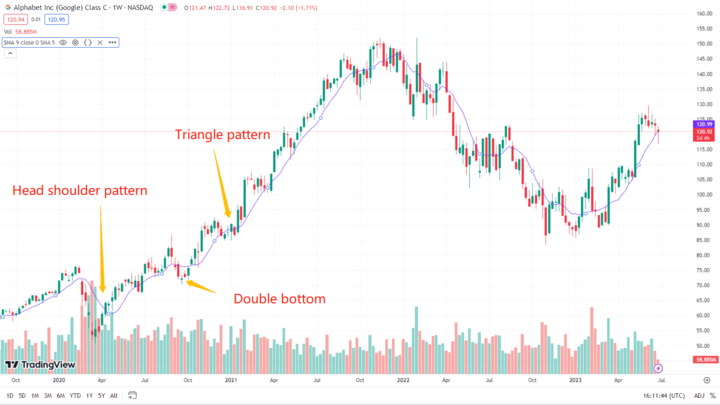
Here's an example of how to use chart patterns to trade Google stock on TradingView:
Source: TradingView
-Use a candlestick chart to visualize the price action of Google stock.
-Utilize the horizontal line tool to draw support/resistance levels and breakout points of the chart patterns.
-Identify specific chart patterns formed by Google stock, such as head and shoulders, double bottoms, triangles, etc.
For instance, in August 2020, Google stock formed a head and shoulders pattern, a bearish reversal pattern indicating a change from an uptrend to a downtrend. This pattern consists of three peaks: a left shoulder, a head, and a right shoulder, with the head being the highest peak and the shoulders lower and roughly equal in height. It also has a neckline, a horizontal line connecting the lows of the two shoulders. A bearish signal is confirmed when the price breaks below the neckline with high volume. The target price for this pattern is calculated by subtracting the pattern's height from the neckline. In this case, Google stock broke below the neckline at approximately $1,500 per share with high volume in September 2020, indicating a bearish signal. The target price for this pattern was around $1,300 per share ($1,500 - $200), which was reached in October 2020.
Another example is a double bottom pattern formed by Google stock in October 2020. This bullish reversal pattern indicates a change from a downtrend to an uptrend. The pattern consists of two troughs: a left bottom and a right bottom, separated by a peak. It also has a neckline connecting the highs of the two bottoms. A bullish signal is confirmed when the price breaks above the neckline with high volume. The target price for this pattern is calculated by adding the pattern's height to the neckline. In this case, Google stock broke above the neckline at around $1,600 per share with high volume in November 2020, indicating a bullish signal. The target price for this pattern was approximately $1,800 per share ($1,600 + $200), which was reached in December 2020.
In January 2021, Google stock formed a triangle pattern, a bilateral pattern indicating market uncertainty followed by a breakout. The pattern consists of converging trend lines connecting lower highs and higher lows. A breakout occurs when the price surpasses one of the trend lines with high volume. Google stock broke above the upper trend line at around $1,900 per share with high volume in February 2021, indicating a bullish breakout. The target price for this pattern was around $2,100 per share ($1,900 + $200), which was reached in March 2021. Potential entry points for buying Google stock include breakouts above resistance levels or bullish chart patterns, indicating an uptrend or momentum. Potential exit points for selling Google stock include breakdowns below support levels or bearish chart patterns, indicating a downtrend or momentum. Traders can also use trailing stops or profit targets to manage their positions.
Trading Strategies for Google Stock
Google stock offers numerous opportunities for traders who employ technical analysis. Technical analysis involves analyzing stock price movements and patterns using charts, indicators, and other tools to identify entry and exit points, support and resistance levels, and price trends that indicate market direction and strength.
A. Trading Styles for Google Stock
Traders can adopt different trading styles for Google stock based on their time horizon, risk tolerance, and goals. Some common trading styles include:
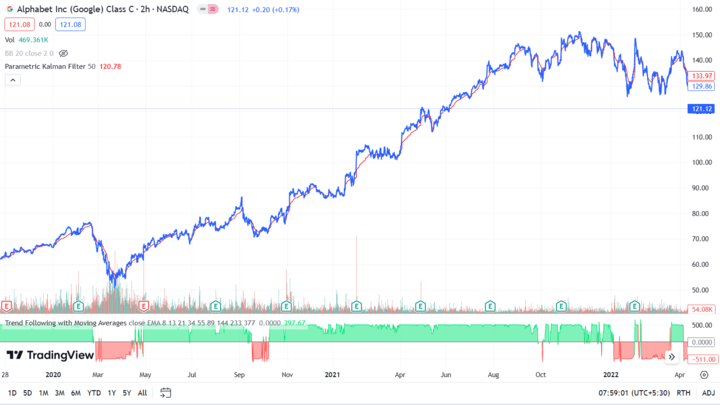
1. Trend Following Strategies:
-Identify and trade in the direction of the stock's dominant trend.
-Use moving averages, trend lines, or indicators to identify and follow the trend.
-Suitable for Google stock, which has exhibited a strong uptrend since March 2020, with rising prices and the 50-day EMA consistently above the 200-day EMA.
Source: TradingView
2. Mean Reversion Strategies:
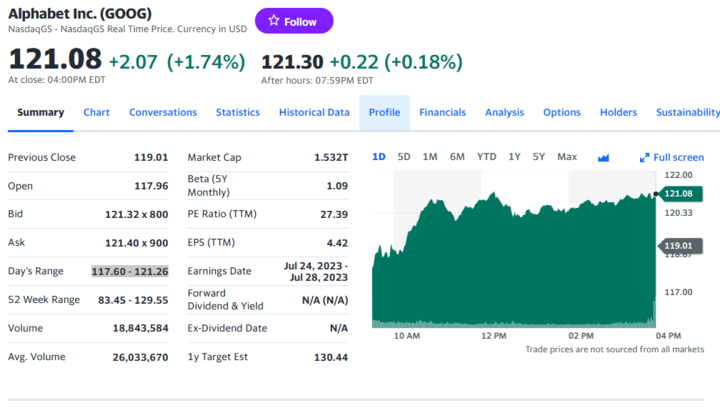
-Trade against the trend, anticipating price reversion to its mean or average level after an extreme move.
-Use oscillators (RSI or Stochastic) or indicators (Bollinger Bands or Fibonacci retracements) to identify overbought or oversold conditions and potential reversal points.
-Suitable for Google stock, which has traded within a range between $117-121 per share in recent months trading, creating a sideways trend.
Source: YahooFinance
3. Breakout Trading Strategies:
-Trade when the price breaks out of consolidation patterns (e.g., triangles, wedges, rectangles), signaling trend continuation or change.
-Confirm breakouts and their direction using volume, candlestick patterns, or indicators.
-Suitable for Google stock, which has experienced short-term price swings or fluctuations within its long-term uptrend, presenting breakout trading opportunities.
Each strategy has pros and cons. Trend-following strategies can yield significant profits in trending markets but may generate false signals in choppy markets. Mean reversion strategies can exploit short-term corrections in ranging markets but may incur losses in trending markets. Breakout trading strategies can benefit from volatility and momentum in breakout markets but may face fakeouts and reversals in consolidating markets.
B. Entry and Exit Points, Support and Resistance Levels
Traders can utilize technical analysis tools to identify potential entry and exit points, as well as key support and resistance levels for Google stock:
1. Entry Points:
-Look for entry opportunities when the price bounces off or pulls back to the 50-day EMA during an uptrend.
-Consider entry near the lower boundary of the range in a sideways trend.
-Identify bullish candlestick patterns or chart patterns near support levels or trend lines for swing trades.
2. Exit Points:
-Consider exiting positions if the price breaks below the 50-day EMA in an uptrend.
-Evaluate exiting when the price reaches or bounces off the upper boundary of the range in a sideways trend.
-Observe bearish candlestick patterns or chart patterns near resistance levels or trend lines for swing trades.
3. Support and Resistance Levels:
-Use horizontal lines, trend lines, moving averages, Fibonacci retracements, pivot points, or other tools to identify support and resistance levels.
-Support levels indicate where the price tends to bounce off or find buyers, while resistance levels suggest potential reversals or seller presence.
C. Risk Management Strategies
Implementing effective risk management is crucial for any trading strategy. Consider the following risk management strategies for trading Google stock:
1. Stop-Loss Orders:
-Set stop-loss orders at predetermined price levels to automatically close trades if the market moves unfavorably.
-Limit losses and preserve capital using stop-loss orders.
2. Position Sizing:
-Determine trade size based on risk-reward ratios, stop-loss levels, and account size.
Trade Google Stock CFDs at VSTAR
When it comes to trading Google stock CFDs, VSTAR offers several notable advantages that enhance the trading process. Let's explore some of these benefits:
● Leverage: VSTAR provides leverage of up to 1:200 for trading Google stock CFDs. This means that traders can control larger positions than their initial capital by borrowing funds from VSTAR.
● Short Selling: VSTAR allows investors and traders to engage in short selling with Google stock CFDs. This means they can profit from a declining market by selling an asset they don't own, then repurchasing it at a lower price later.
● Lower Costs: Compared to direct stock trading, VSTAR offers cost advantages. It doesn't charge commissions, stamp duty, or exchange fees.
● Market Access: VSTAR provides access to a broader range of markets than traditional stock trading.
In addition to these benefits, VSTAR furnishes users with a range of tools and features to enhance their trading experience and performance. Advanced charting, technical analysis capabilities, market news updates, educational resources, and responsive customer support contribute to a well-rounded trading environment.
Conclusion
Now, in conclusion, we can assert that technical analysis proves to be an invaluable tool for maximizing profits in the realm of trading Google stock. Through a comprehensive understanding of diverse technical indicators and their predictive capabilities, traders can foster informed decision-making, ultimately enhancing the likelihood of success.
Of course, technical analysis is not a guarantee of profits. The stock market is unpredictable, and there is always the risk of losing money. Nevertheless, by incorporating this guide into your overarching trading strategy, you can significantly augment your prospects of triumph while mitigating associated risks.
