In its next report, Wall Street analysts anticipate that Fastenal (FAST) will report quarterly profits of $0.48 per share, representing a 4.4% rise from the previous year.
FAST Revenue Forecast
Revenues are anticipated to reach $1.85 billion, a 5% increase over the previous quarter. The consensus EPS forecast for this period has not changed over the past 30 days. This indicates how the covering experts have collectively revised their initial projections over this period.
Examining analysts' expectations for some of the business's important metrics might provide a more thorough view, even if investors usually use consensus profits and sales estimates as a benchmark to assess the company's quarterly success.
In light of this, let's examine the average forecasts of a few Fastenal KPIs that Wall Street analysts often monitor and forecast.
'Business days' are generally estimated to be 63.00 days. The business recorded sixty-two days in the same period last year, which is in contrast to the current estimate.
Analysts' average forecast 'Daily sales' is $29.37. The projection contrasts with the $28.40 value from a year ago.
Analysts agree that there will be 2,023 "Number of active Onsite locations." The company recorded 1,822 in the same period last year, which is more than the current estimate.
FAST Key Financial Metrics
The P/E ratio for the company maintained a stable position above the 32.00 level for the last 6 consecutive quarters with the P/S ratio over 5.00. It signals a stable earnings position backed by a positive liquidity position from the 1:4.4 current ratio.
In the long-term debt position, the company has enough space to generate funds from the debt finance as the Debt-to-asset ratio remains stable at 0.11 for four consecutive quarters.
Fastenal Stock (FAST) Technical Analysis

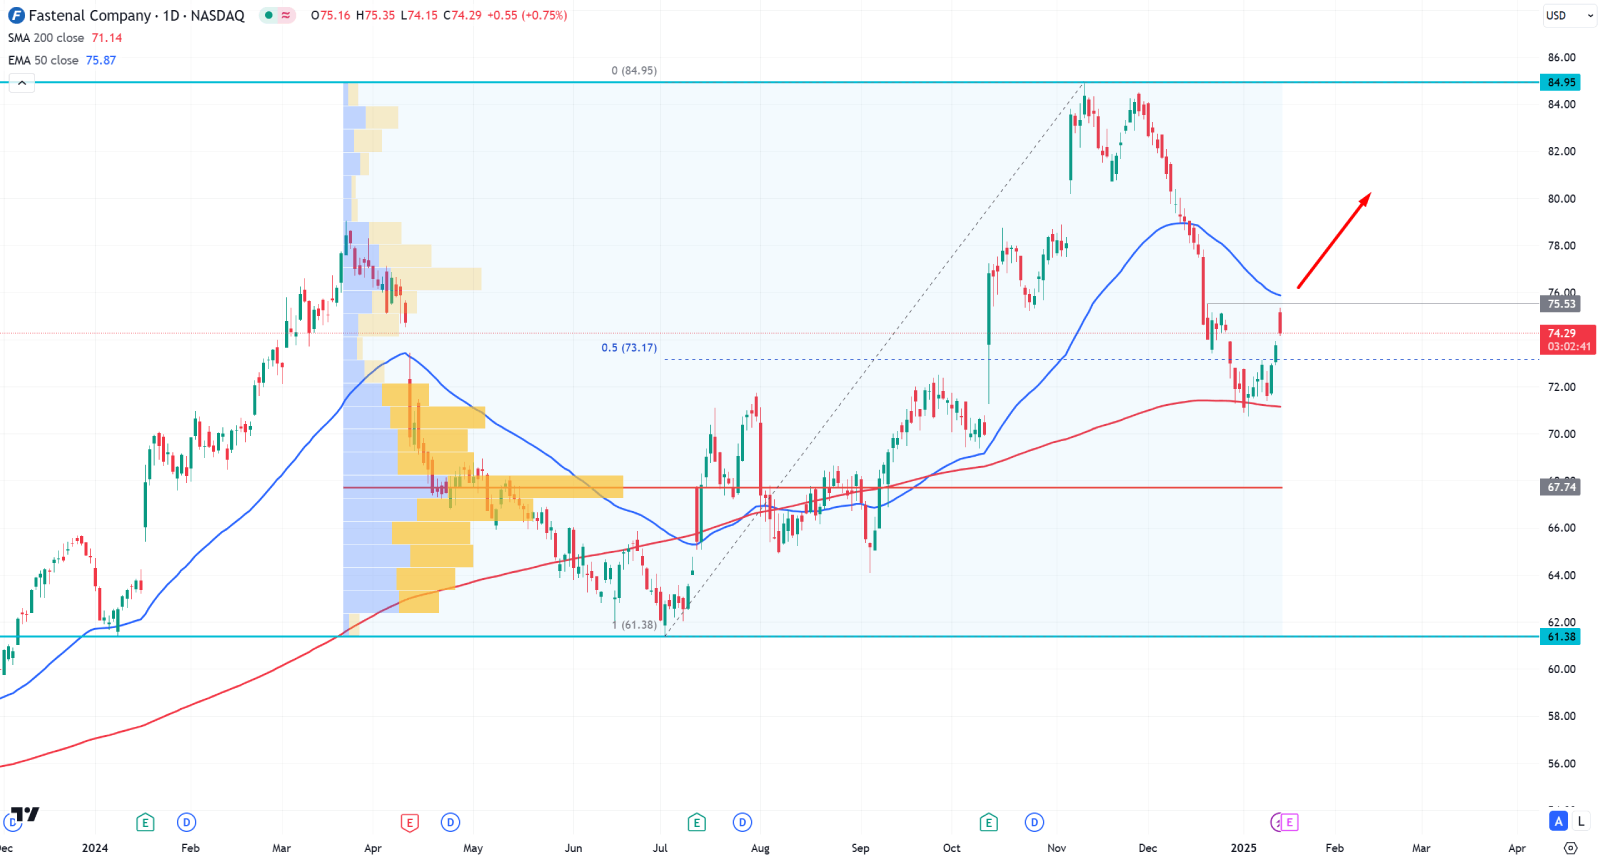
In the daily chart of FAST stock price, the current tradable range is visible from the 61.38 low to 84.95 high. As the current price is trading below the 50% Fibonacci Retracement level of this zone, a bullish attempt might appear from the discounted price zone.
In the broader context, the most recent Fastenal stock price showed a bullish reversal from the 200 day SMA line. However, the 50 day EMA is working as an immediate resistance, which could be the primary barrier to bulls.
Based on the current market outlook, the ongoing bullish pressure might validate after overcoming the 50 day EMA line. On the bullish side, the price is likely to extend and test the 84.00 level, before reaching beyond the 90.00 area.
On the bearish side, a consolidation might happen in case the price fails to overcome the 50 day EMA line. In that case, a selling pressure below the 200 day SMA could lower the price towards the 60.00 psychological line.


