While the New Zealand dollar hit its highest level of the year, the Australian dollar took advantage as inflation figures decreased more than anticipated and did not work to move the knob on rate cuts.
Both had been encouraged by expectations that China's most recent stimulus package would help stimulate demand in that country and support charges for Antipodean commodity exports.
Australian CPI Update
According to Australia's every-month consumer price index (CPI), the annual pace decreased to 2.7% in August from 3.5%. That marked a three-year minimum as well as within the 2-3% target range set by the Reserve Bank of Australia (RBA), although a large portion of the decline was attributable to short-term power rebates from the government.
While core inflation decreased from 3.8% to 3.4%, it was still significant enough to stay beyond the RBA band and act as a barrier to rate cuts.
RBA Policy Decision
The chairman of the RBA explicitly stated that policy alleviation could not be considered until core inflation improved.
Investors interpreted Governor Michele Bullock's admission that the policymakers had not specifically discussed raising interest rates—a first since March—as somewhat dovish.
By now, markets are implying a 25% likelihood of a quarter-point reduction in the cash rate of 4.35% in November and a 75% probability of a move in December. By the end of the following year, rates are expected to be 3.25%, as opposed to 2.80% for the US Federal Reserve and 1.73% for the European Central Bank.
What's For The Euro?
During the week, investors were not drawn to the Euro because the European statistics were not as good as expected.
Surprisingly, the German IFO poll on business conditions eased from 86.6 in August to 85.4 in September. As anticipated, expectations dropped to 86.3, while the current state of affairs evaluation worsened to 84.4.
EURAUD Technical Analysis
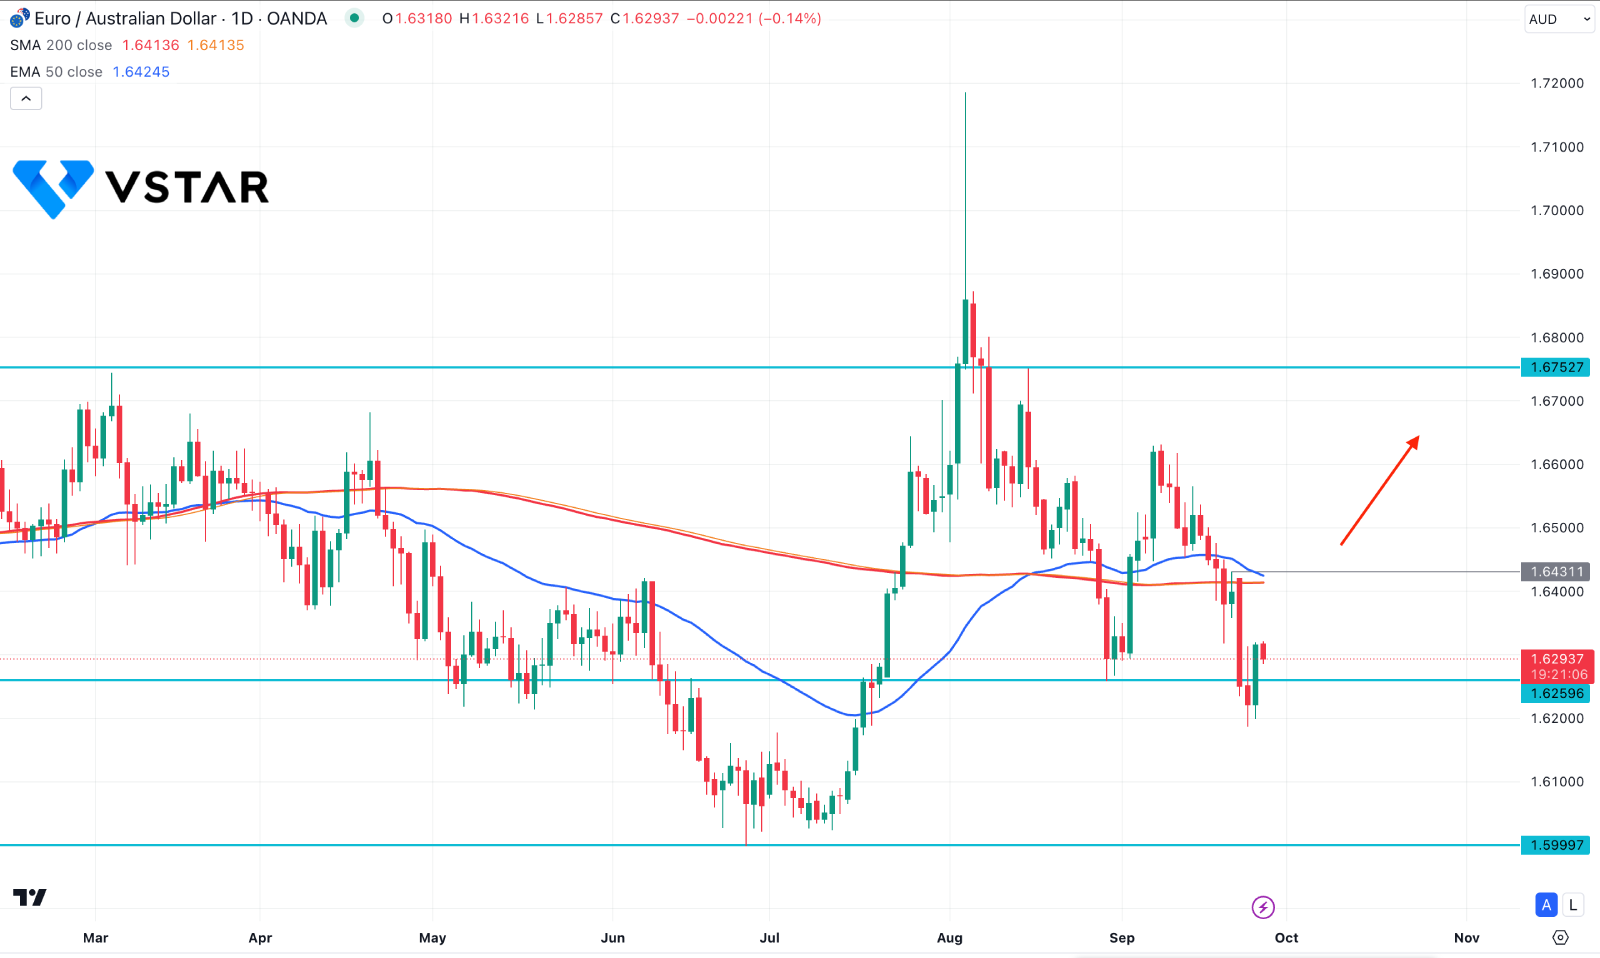
In the daily chart of EURAUD, the current price is trading below the crucial 200 day Simple Moving Average line. However, the deeper selling pressure below the 1.6259 level with an immediate bullish recovery, signals a minor sell-sidel liquidity sweep.

Although the recent price is trading sideways, the broader market trend remains bullish, within the wave starting from the 1.5999 low to 1.7200 high. In that case, investors should monitor how the price trades at the dynamic line.
A bullish break with a daily candle above the 1.6431 level could open a long opportunity, aiming for the 1.6800 level. However, a failure to extend the buying pressure above the 200 day SMA might initiate a selling momentum towards the 1.6100 area.


