Decentraland (MANA) trading volume surged recently, showing an interest in bulls with an upward possibility. Social dominance, X MANA news, follower count, and social volume, have experienced a significant increase subsequent to a prior decline in these indicators. This signifies a revival in the allure of Decentraland on social media platforms and reaffirms a previous decline in its popularity.
In addition, social media functions as a substantial direct channel for emphasizing cryptocurrency initiatives, as evidenced by MANA's increasing social dominance, volume, and follower count.
MANA Price Experienced A Surge In Daily Transactions
Moreover, active addresses denote distinct addresses of users of the MANA cryptocurrency who are involved in one or more transactions during specified time periods. A total of 734 transactions have occurred in the previous twenty-four hours, suggesting a rise in activity. As an increasing number of users actively participate in the cryptocurrency, this indicates a growing demand and value for MANA. This reflects trends in both short-term and long-term adoption.
Furthermore, financial indicators such as daily on-chain transaction volume in profit, volume in loss, and the profit-to-loss ratio could work as key price drivers for a crypto coin.
MANA On-chain Metrics: Volume In Profit
The profit-to-loss ratio for daily on-chain transaction volume in profit exceeds $14.08 million, and the volume in loss is $7.91 million; thus, the majority of MANA holders appear to be in a favorable position. This indicates a positive momentum for MANA, while a rising ratio and increasing profit volume indicate an uptrend and expanding momentum for Decentraland as an increasing number of holders realize profits.
Decentraland Price (MANAUSD) Technical Analysis
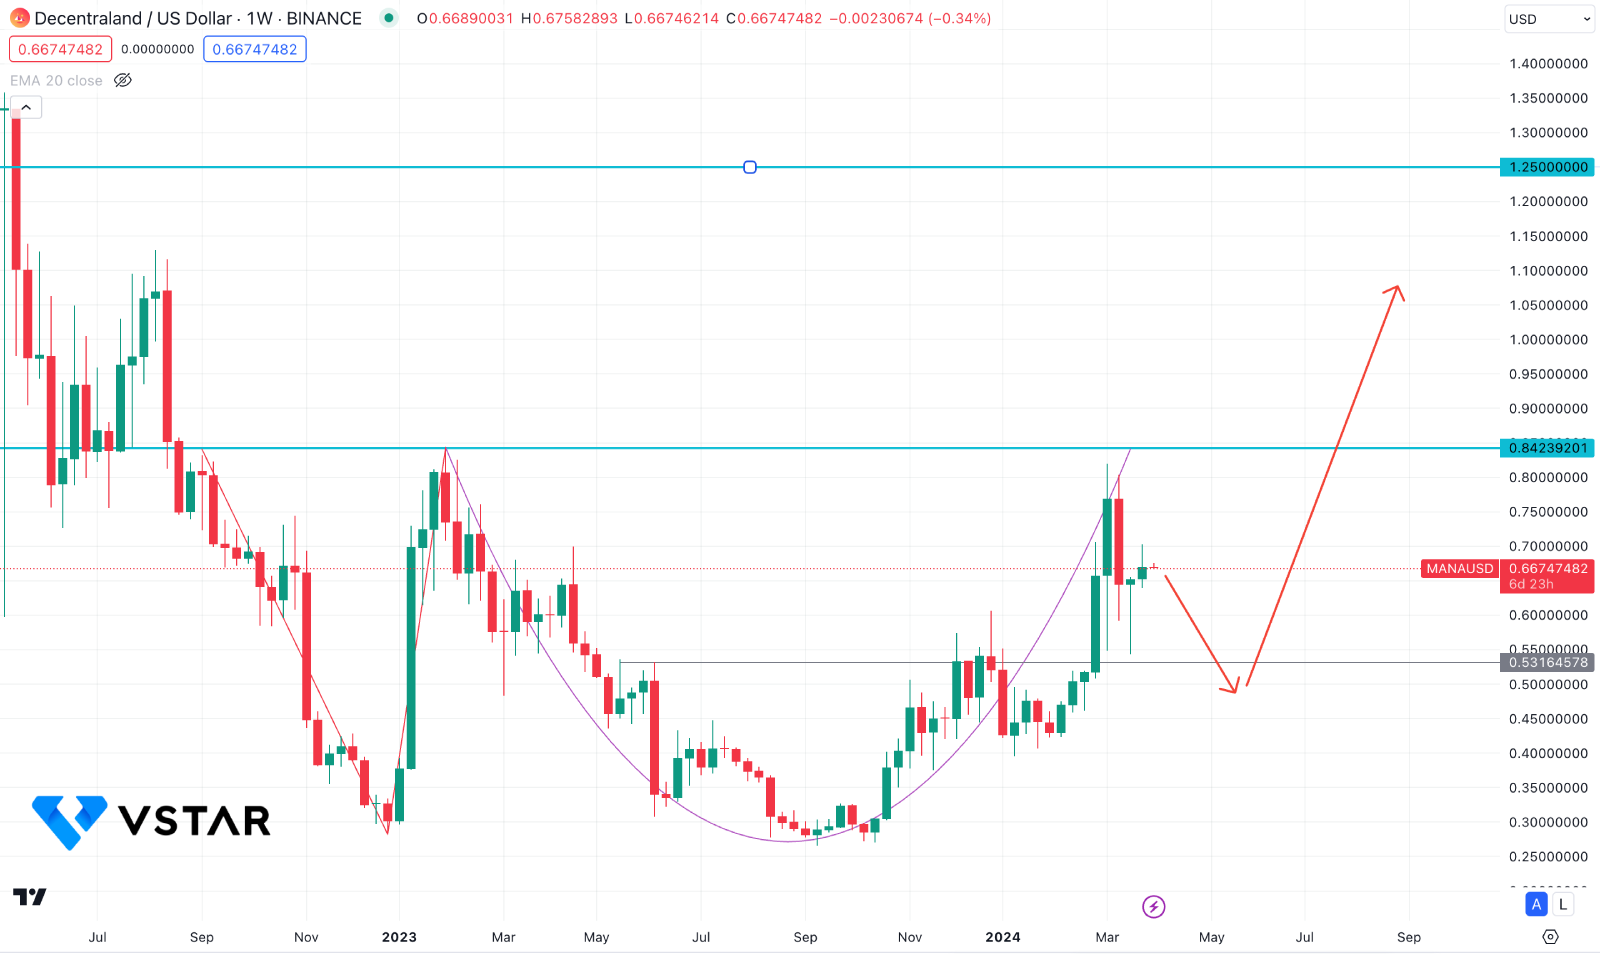
Decentraland (MANA) consolidates the weekly price, where the recent bullish rebound suggests a possibility of a bullish breakout. As the recent price hovers below the 0.8423 resistance level, a successful bullish breakout could extend the buying pressure above the 1.00 mark.
The price remained sideways below the 0.7880 key resistance level for more than 500 days and is now approaching this level by creating multiple bases. In the last 2-year consolidation, a potential bullish Adam and Eve pattern is visible, which could work as a strong breakout opportunity.
In this pattern, a strong V-shape recovery is the first phase, followed by a round. As per the pattern formation, a downside correction and a liquidity sweep from the 0.5316 low is possible. Later on, a bullish daily candle above the 0.8423 line could validate the breakout and open the room for reaching the 1.2000 level.
On the other hand, a failure to hold the price above the 0.5300 level could be an alarming sign to bulls, which could invalidate the Adam and Eve pattern. In that case, extensive downside pressure might come, targeting the 0.3000 level.

