With Arabica plunging to a 13-year nearest-future peak, the cost of coffee settled significantly higher. Moreover, Coffee prices reached the crucial overextension level, from where a decent downside recovery is pending.
Why Coffee Price Moved Higher
On Wednesday, fund purchases of coffee futures were driven by worries about longer-term crop damage from the Brazilian drought situation. Since April, Brazil's rainfall has been continuously below average, harming coffee plants during the crucial phase of flowering and decreasing the country's chances of producing an Arabica coffee harvest in 2025–2026.
According to Cemaden, a natural disaster tracking center, Brazil has been experiencing its driest weather since 1981.
Coffee Prices: Key Fundamental Releases
Following the announcement last Monday by the General Department of Customs of Vietnam that the country's October coffee exports dropped 11.6% month over month to 45,412 MT, and its January-October coffee exports fell 11.1% year over year to 1.15 MMT, robusta prices are being supported by rigid robusta supplies.
Another factor supporting robusta coffee is concerns that heavy rains in Vietnam may flood coffee fields and postpone the country's coffee harvest. Vietnam, the largest producer of robusta in the world, is just beginning its coffee harvest.
Decreased robusta production supports robusta coffee cost. On March 26, Vietnam's agricultural ministry announced that the country's drought-related coffee cultivation in the 2023–2024 crop year fell by -20% to 1.472 MMT, the lowest amount in four years.
Vietnam's robusta coffee cultivation is expected to decrease slightly to 27.9 million sacks in the upcoming marketing calendar year of 2024/25 from 28 million sacks in the 2023/24 season, according to a USDA FAS projection released on May 31.
Coffee Prices Projection: Key Events To Look At
Conab, Brazil's crop predicting agency, reduced its 2024 Brazil coffee farming projection on September 19 from May's estimate of 58.8 million bags to 54.8 million bags, which helped to boost coffee prices.
Recent downpours in Brazil momentarily alleviated concerns about dryness. Rainfall in Minas Gerais, Brazil's largest arabica coffee-growing region, was 60.9 mm last week, 127% of the past average, according to a report by Somar Meteorologia. Minas Gerais is Brazil's largest producer of arabica coffee.
Given that the International Coffee Organization (ICO) stated on November 8 that global coffee exports in September increased +25% year-over-year to 10.76 million bags and that shipments from October to September increased +11.7% year-over-year to 137.27 million bags, indications of a larger global supply of coffee are negative for prices.
ICO's Opinion On Coffee Prices
The International Coffee Organization (ICO) predicted this past month that a remarkable off-biennial growing season would cause global coffee production to rise +5.8% year over year to an unprecedented 178 million bags, which is a negative factor.
Additionally, ICO predicted that global caffeine consumption would reach an all-time high of 177 million bags in 2023–2024, up +2.2% yearly, creating a surplus of one million bags.
On June 20, the USDA released its biannual report, which was negative for coffee prices. The Foreign Agriculture Service (FAS) of the USDA predicted that global coffee production would rise 4.2% year over year to 176.235 million bags in 2024–2025, with robusta production rising 3.9% to 76.38 million bags and arabica production rising 4.4% to 99.855 million bags.
Coffee Prices Technical Analysis
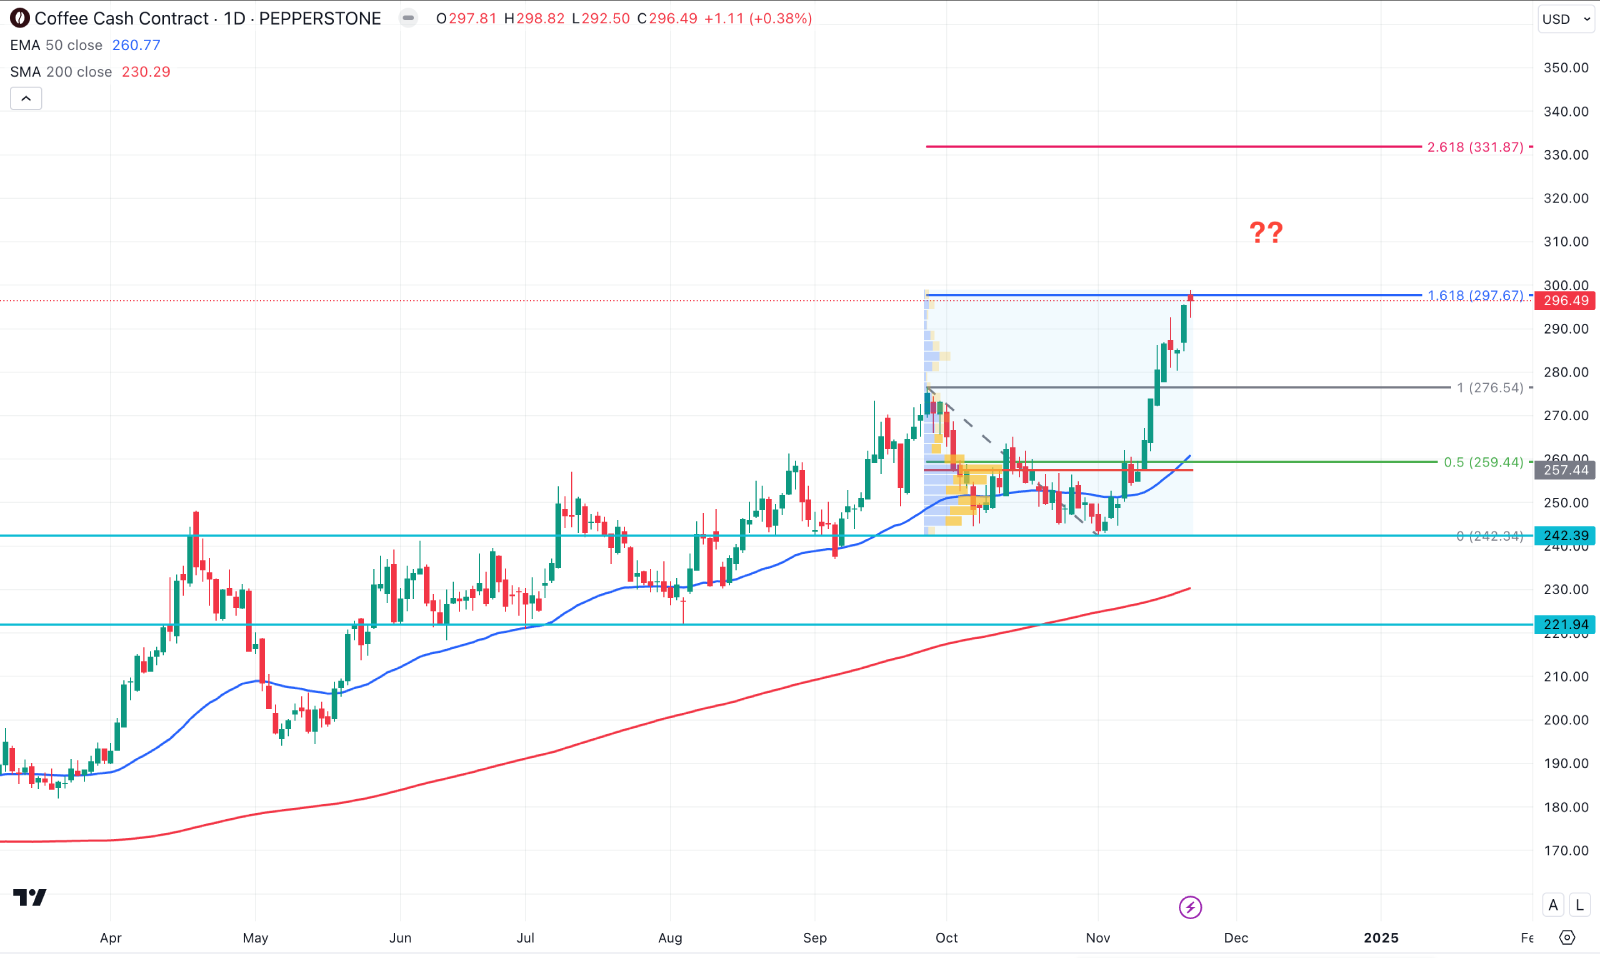
In the daily chart of COFFEE, the ongoing market momentum is bullish, initiated from a bullish symmetrical triangle breakout.
In the major structure, the 200-day SMA is acting as major support, while the 50-day EMA and 200-day SMA are below the current price. This is a sign of a strong bullish trend, as a golden cross continuation, creating a decent continuation opportunity.
On the other hand, the volume structure looks positive for bulls, as the current high volume line hovers above the 50-day EMA line.
Based on the current market structure, the price has reached the crucial 161.8% Fibonacci Extension level with a gap with dynamic lines. This is a sign of a bullish overextension, from which a decent downside correction is pending. In that case, a failure to overcome the 300.00 level could initiate downside pressure targeting the 50-day EMA line.
However, the bullish momentum is solid, and overcoming the 300.00 line could extend the buying pressure and test the 331.48 level as a secondary resistance.
