Chainlink (LINKUSD) has evolved into a crucial indicator of the altcoin ecosystem as a whole in the turbulent cryptocurrency market. Michaël van de Poppe, a renowned crypto analyst, recently underscored the significance of LINK's performance, positing that its fluctuations frequently establish a precedent for other alternative cryptocurrencies.
Analysts Opinion On Chainlink
Van de Poppe highlighted Chainlink's robust trajectory in a noteworthy tweet, suggesting that it functions as an indicator for the altcoin market as a whole. His statement suggests that should LINK achieve success, additional alternative cryptocurrencies will likely do the same. He added that LINK is anticipated to maintain its ascent toward annual highs so long as its price remains above $16.
Traders and investors are optimistic in light of this recent momentum, given that Chainlink frequently serves as a leading indicator of the sentiment of the altcoin market as a whole. Speculators and analysts are diligently observing Chainlink to determine whether it can sustain its ascent to annual peaks; such development has the potential to incite a favorable trend throughout the altcoin market.
LINK As An Altcoin Indicator
Amidst the inherent instability of the markets, it is advisable for participants to closely monitor Chainlink's price fluctuations in the forthcoming days and weeks. The potential consequences of the results may have substantial ramifications for the digital asset industry as a whole, impacting investor sentiment and market dynamics.
The barometer function of Chainlink in the altcoin market highlights its substantial importance within the cryptocurrency ecosystem. Throughout the course of events, market participants will closely observe whether the ongoing strength of Chainlink maintains its influence on wider market patterns, potentially initiating a significant era for the altcoin sector.
Chainlink Price Prediction Technical Analysis
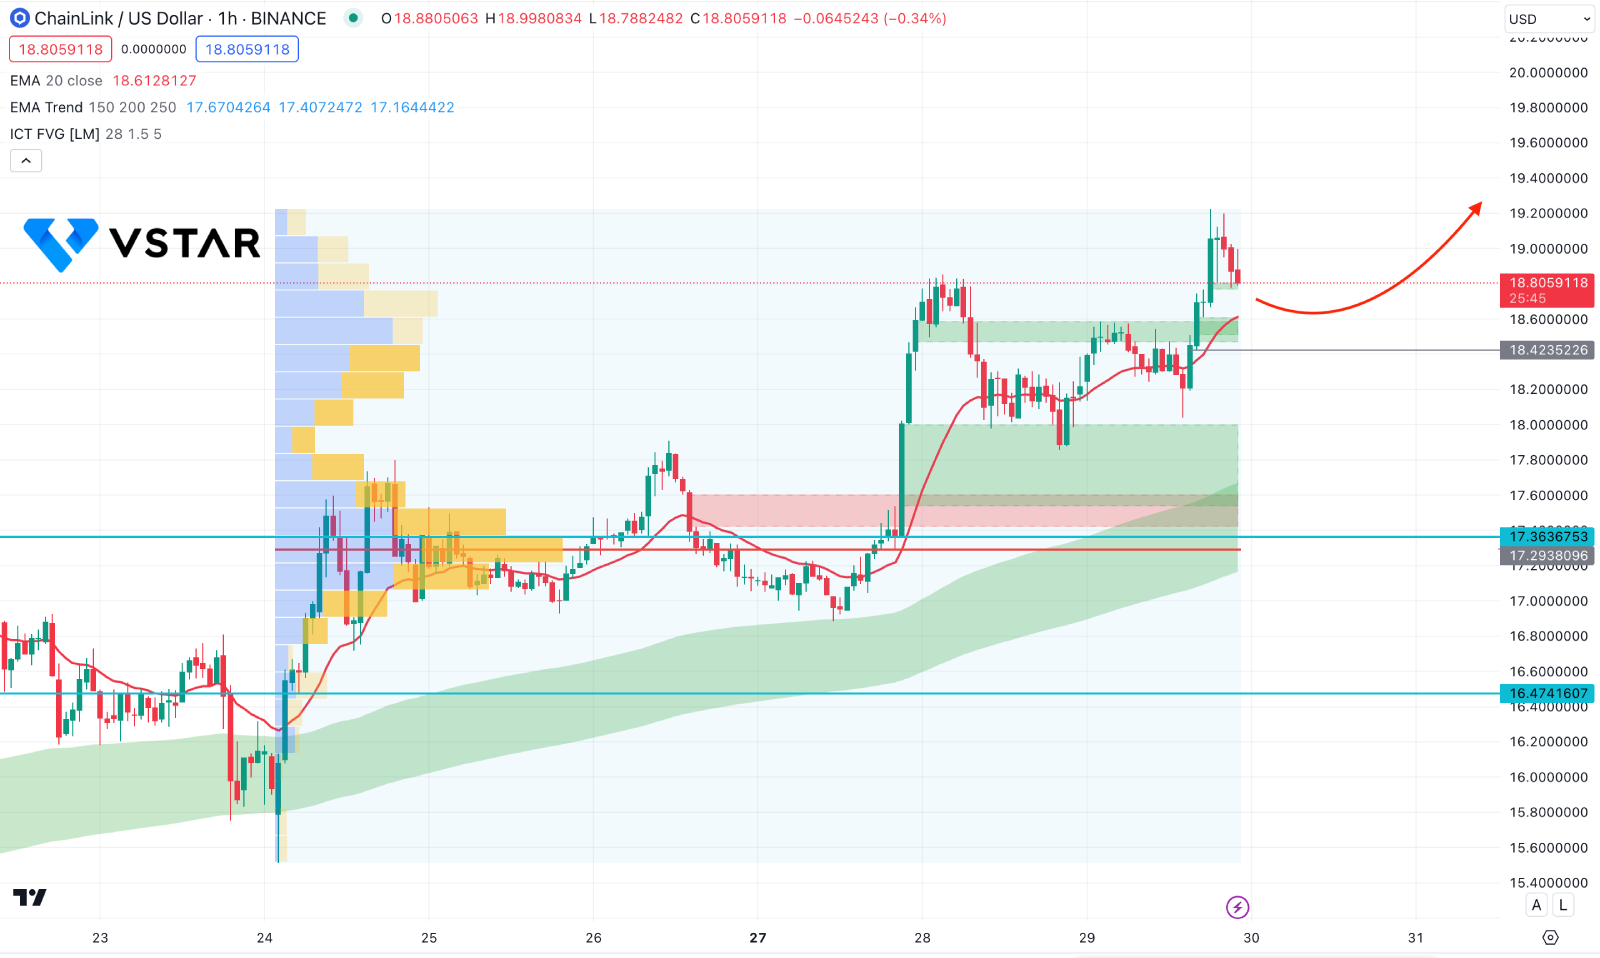
As per the daily outlook of LINKUSD, the ongoing bullish trend is valid, where the recent price trades above the dynamic 20 day EMA line. In that case, the primary aim of this instrument is to look for long trades from the near-term bullish demand zone.
In the broader context, the MA wave remains steady below the current price, suggesting an ongoing bullish, stable trend. However, the recent price left some imbalance, which needs to be filled before offering a valid long signal.
Based on the daily LINK price prediction, an extensive downside correction and a bullish reversal from the 18.00 to 17.43 zone could be a high probability of a long opportunity, targeting the 20.00 level.
However, the bullish possibility is valid as long as the price trades above the 17.29 high volume line. A bearish break below this line with a bearish daily candle could lower the price toward the 16.47 support level.