The Chainlink price (LINKUSD) has drawn attention as it approaches significant resistance levels. A number of technical indicators point to possible further moves.
Chainlink On-chain Metrics Analysis
With LINK's 7-day MVRV Ratio at 7.9%, there may still be an opportunity for a price increase for the asset. The MVRV (Market Value to Realized Value) percentage evaluates shareholders' prospective profitability by comparing the present market value of coins to the average price at which they were purchased.
An elevated MVRV ratio typically denotes a larger level of unrealized earnings for holders, which may result in more selling pressure and possible price adjustments. On the other hand, an inadequate MVRV ratio implies that fewer investors are making money, which lessens the chance of a significant sell-off.
MVRV criteria have changed over time, but historically, a value of 10% has frequently indicated overvaluation and suggested corrections. In particular, the price of LINK has been constant over the past six months, even though the MVRV has gotten close to 10%. But once this barrier was crossed, the price of LINK corrected since traders probably grabbed profits at high levels.
Given its present MVRV of 7.9%, LINK seems to have some potential for price increase. However, since the ratio is getting close to the 10% mark, it's critical to watch this statistic carefully. A climb over that would suggest that there is a greater chance of a downturn as more investors reach profitable levels and might think about selling.
LINK Outlook Based on Directional Movement Index (DMI)
Currently, LINK's Directional Movement Index (DMI) is displaying a lot of bullish momentum. Buyers are clearly in the lead over sellers, as seen by the Positive Directional Index (+DI) of 29.2, far higher than the negative Directional Index (-DI) of 13.3. With a trend strength indicator of 28.2, the Average Directional Index (ADX) indicates that the present trend will continue.
The +DI, -DI, and ADX are the three main indicators that make up the DMI. The ADX gauges the overall strength of the trend, whilst the +DI and -DI monitor the strength of upward and downward price moves. Strong movements are sometimes indicated by an ADX above 25, whereas lower values indicate weaker moves or stabilization. Bullish momentum is indicated when the +DI exceeds the -DI, while a bearish feeling is suggested when the opposite is true.
Given that the ADX is over 25 and the +DI is significantly greater than the -DI, LINK is on a strong rising trend. This implies that if purchasing pressure remains strong, its price may rise further in the near future. The interplay within the +DI and -DI lines, particularly, may indicate future reversals, and traders on the ADX should watch closely for any changes in the trend's strength.
Chainlink Price Prediction Technical Analysis
In the LINKUSD daily chart, a corrective market momentum is visible, where the current Chainlink price aimed higher above the dynamic 50 day Exponential Moving Average.
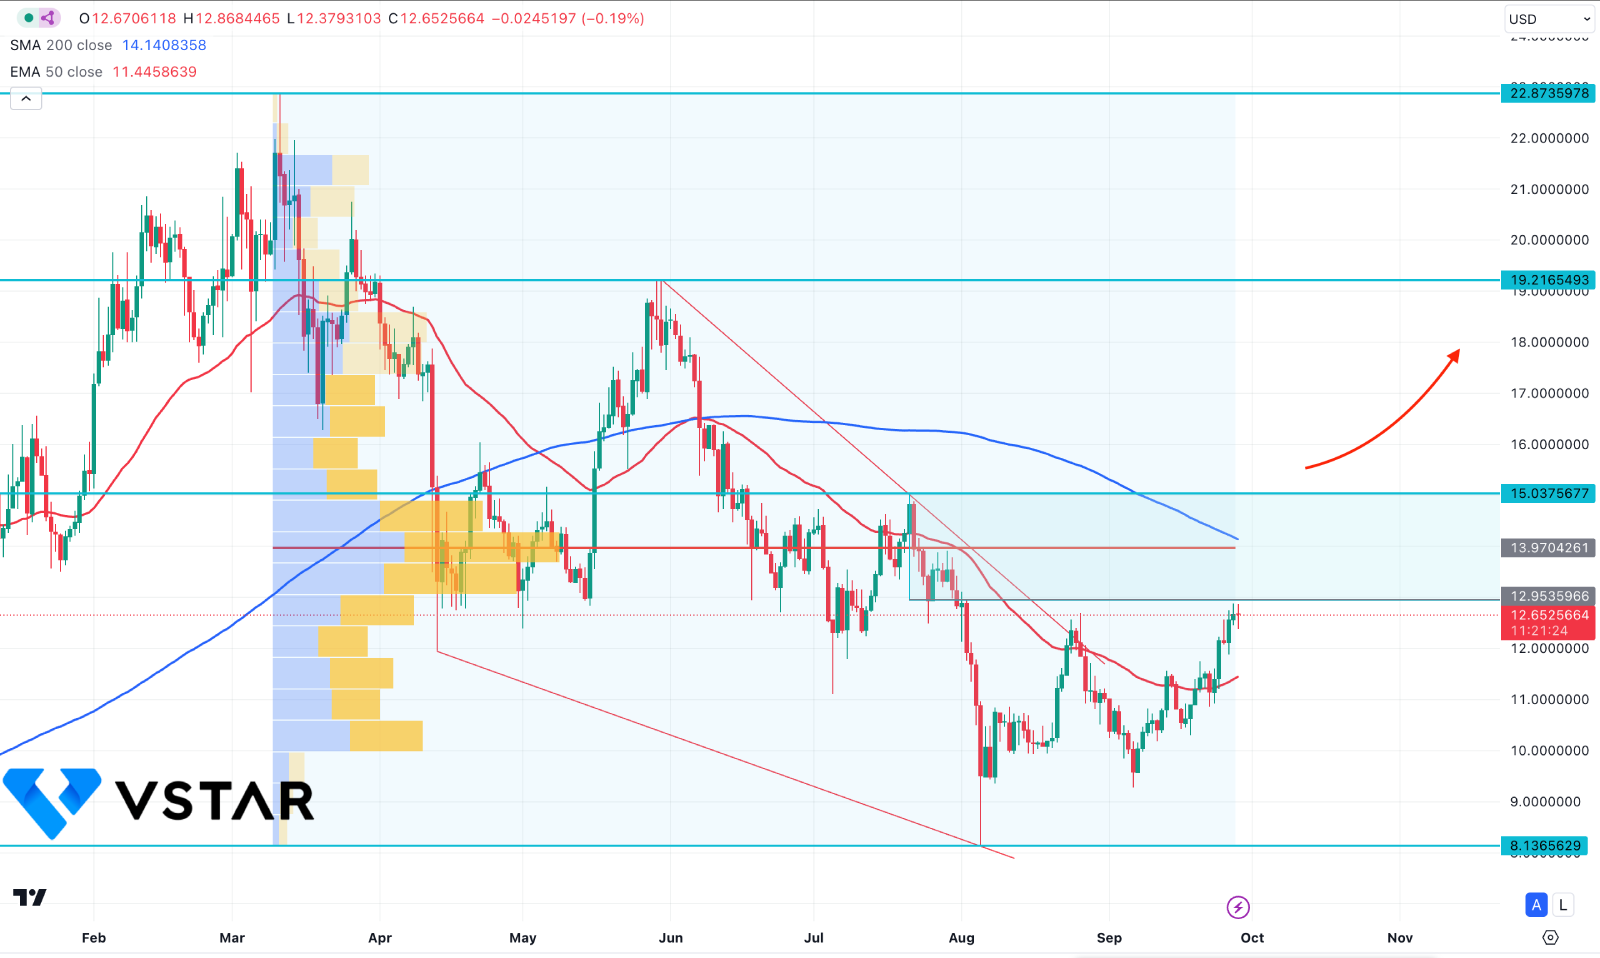
The extensive selling pressure from June 2024 exhausted the price below the 9.000 psychological line and formed an immediate bullish reversal. Moreover, the price maintained a bullish rally base rally formation, creating a valid bottom. In that case, an upward continuation is possible, depending on the upcoming price action.
Currently, the ongoing buying pressure is approaching a crucial supply zone from 15.03 to 12.93. Moreover, the high volume line since March 2024 is within the bearish order block, suggesting a strong barrier to bulls.
Investors should closely monitor how the LINK price trades at the supply area as a valid break with a daily candle above the 15.03 level could open the room for reaching the 20.00 area. However, a massive selling pressure from the near-term supply area with a daily candle below the 50 day EMA could extend the selling pressure below the 9.00 area.
