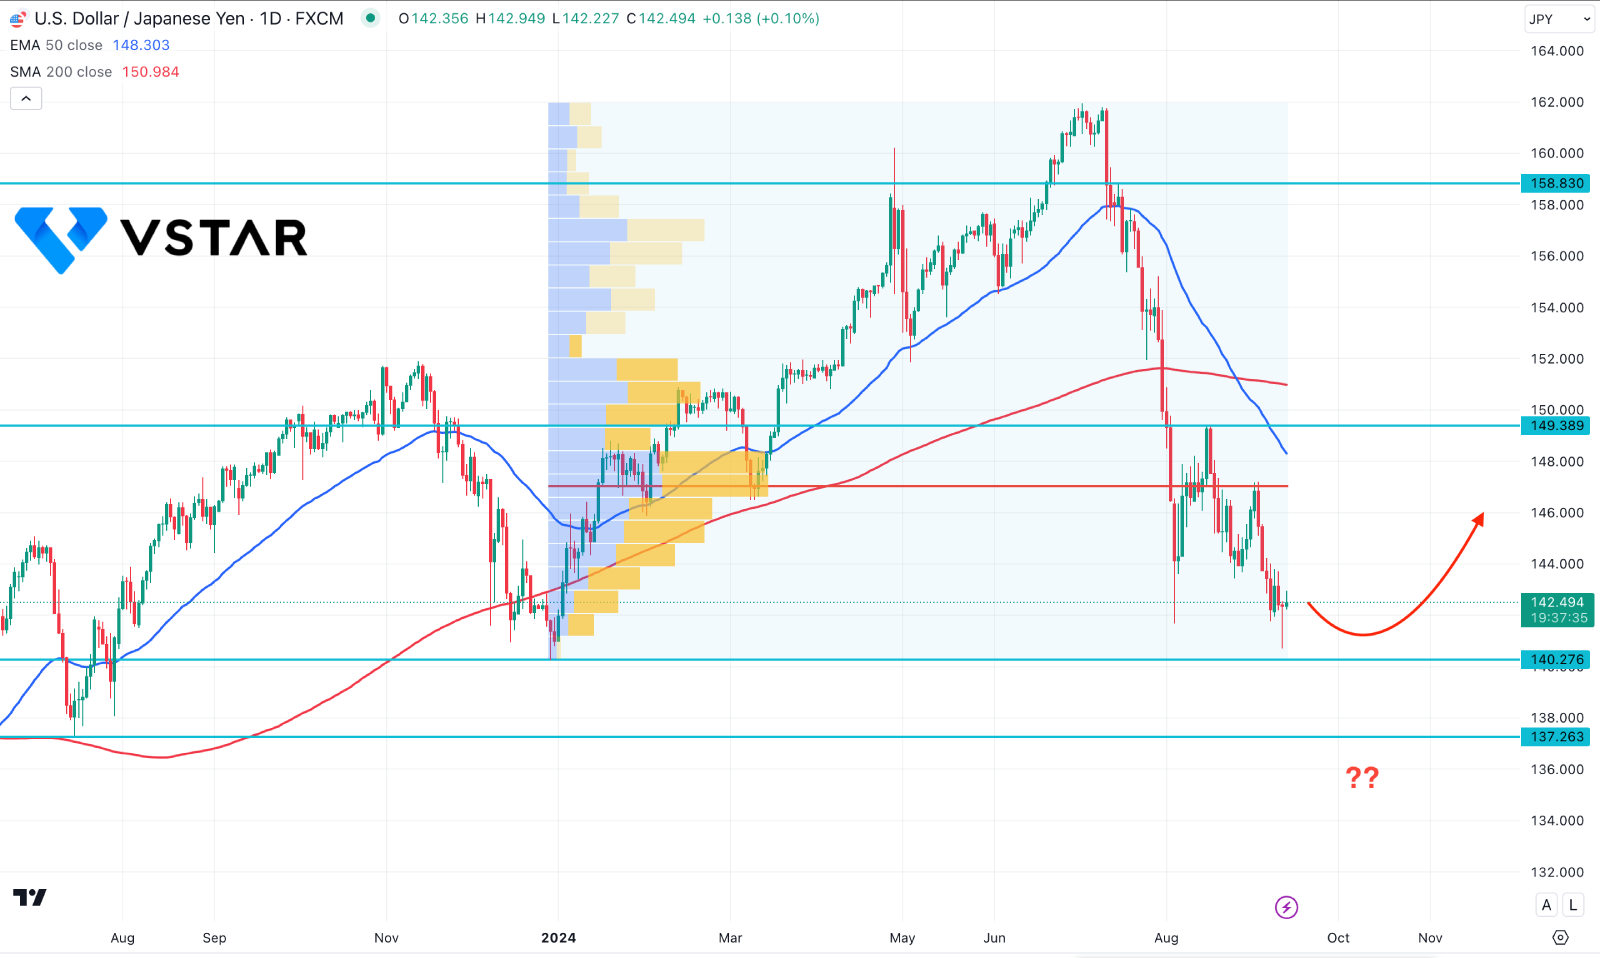
For the second day in a row, the USD/JPY is losing ground, closing below the 143.00 level. In the wake of comments made by Bank of Japan (BoJ) trustee Junko Nagakawa, the Japanese Yen (JPY) is still strong.
BoJ's Comment on Japanese Yen
Board member Nagakawa of the BoJ said that if the country's economy and expenses match its expectations, the central bank might modify the amount of its monetary loosening. Real interest rates are still extremely low, and supportive monetary circumstances remain, even after the rate increase in July. If long-term rates rise, the BoJ may, if needed, review its tapering strategy during its policy conferences.
The divergent monetary regulations of the US Federal Reserve and the Bank of Japan, which have been promoting the reduction of carry investments and increasing demand for the Japanese, contribute to the decline in the USD/JPY pair. Governor of the Bank of Japan Kazuo Ueda reaffirmed the central bank's pledge to keep interest rates rising as long as the Japanese economy grows in line with the bank's projections until FY2025.
What's For The US Dollar Index (USDX)?
US Consumer Price Index (CPI) statistics came in at a 0.2% increase, but the US Dollar (USD) is still weak as Treasury yields keep falling. The forthcoming Producer Price Index data could provide new insights into the possible extent of the Federal Reserve's (Fed) September interest rate reduction. Furthermore, the most recent US job market report has called into question the likelihood of an ambitious Fed loan rate reduction.
Based on the CME FedWatch Analyzer, markets fully expect the Federal Reserve to decrease interest rates by at least 25 basis points (bps) at its meeting in September. A week ago, the probability of a 50 bps rate reduction declined slightly, from 38.0% to 31.0%.
USDJPY Forecast Technical Analysis
In the daily chart of USDJPY, the recent price showed a strong bearish pressure since the beginning of the second half of the year. As a result, the price went below the 200 day Simple Moving Average and maintained the selling pressure for more than a month.

In the volume structure, the largest activity level since January has been at 147.04, from where a bearish continuation has come. It is a sign that the ongoing selling pressure is present, and a continuation of momentum has come from this crucial resistance.
Although a bearish crossover is present in 50 and 200 MA lines, the gap has widened. Also, the price almost reached the 2024 low, which is a crucial support level.
Based on the current outlook, a downside continuation with a valid bullish reversal from the 140.27 to 137.26 area could be a potential reversal signal. In that case, a daily close above the 50 day EMA might extend the upward pressure above the 148.00 area.
Alternatively, as the current downside pressure is present, an immediate selling pressure could lower the price towards the 136.00 level without forming a bullish rebound.


