Morgan Stanley (MS) is expected to release its findings for the quarter that ended in September 2024. Due to higher revenues, earnings are anticipated to be higher than the previous year. Although this well-known consensus perspective well represents the company's revenue picture, comparing the actual results to these projections is a significant factor that could affect the stock price in the coming months.
MS Earnings Forecast
It's worthwhile to handicap the likelihood of an upbeat EPS surprise, even though the sustainability of the current price evolution and future revenue expectations will mainly rely on the management's discussion of company circumstances during the earnings call.
The holding bank anticipates reporting a quarterly profit of $1.57 per share in its next report, a +13.8% increase from the previous year.
It is anticipated that revenues will reach $14.28 billion, a 7.6% increase over the previous quarter. Over the past 30 days, the average EPS prediction for the quarter has been revised to 1.12% lower than its current level. This reflects the encompassing analysts' collective reevaluation of their initial projections during this time.
MS Earnings History Analysis
Analysts frequently consider how well a company has performed in matching previous consensus projections when estimating its future earnings. Therefore, examining the history of surprise is worthwhile in order to assess its impact on the next number.
It was anticipated that Morgan Stanley would release earnings of $1.65 per share for the most recent reported quarter, but instead, it reported a profit of $1.82, following through a surprise of +10.30%.
A stock may move upward or downward for reasons other than a beat or miss in earnings. Despite an increase in earnings, many stocks lose ground because due to other factors. For MS, the technical outlook shows an overbought condition, which might need additional clues to go long.
MS Stock Forecast Technical Analysis

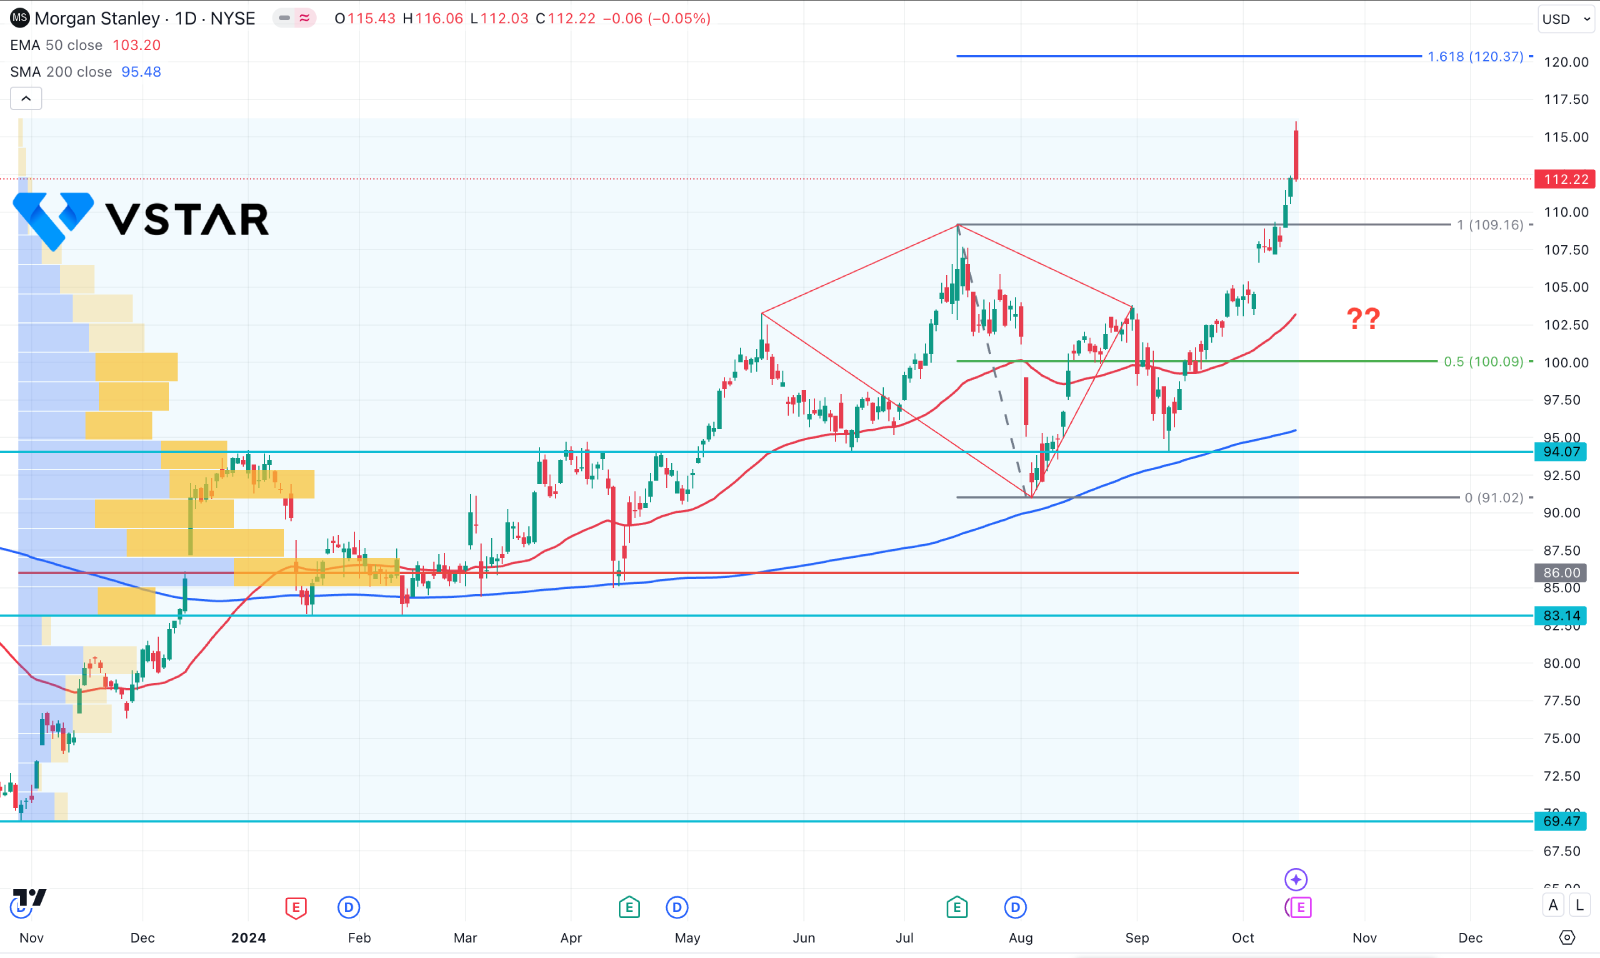
In the daily chart of MS stock price, the broader market momentum is bullish, where themost recent price trades at the record high, following the Diamond Pattern breakout. As the current price overextended from dynamic lines, investors might expect a sufficient downside correction as a mean reversion.
A downside correction in the volume structure is pending as the current price is trading 30% higher than the year's highest volume level. Also, the most recent daily candle showed massive selling pressure at the top, which might work as a potential top formation.
The dynamic 200-day SMA and 50-day EMA lines clearly show a bullish trend, as both are aiming higher and have a bullish continuation signal.
Based on the current market outlook, any struggle to hold the price above the 109.16 key support level could be a potential bearish opportunity, targeting the 88.00 high volume line.
The alternative approach is to seek long signals from the 110.00 to 102.00 zone with a valid bullish reversal, where the main aim is to test the 120.37 Fibonacci Extension level.


