Amidst rumors that China's Ministry of Civil Affairs and Ministry of Finance will offer one-time financial assistance to the extremely poor and orphans before next week's National Day holiday, the stock market in Hong Kong surged.
HK50 Reached The Multi-month High
In the meantime, Xinhua News revealed that to increase employment, the central government has directed the distribution of specific benefits from social security to fresh college graduates who have yet to secure employment within two years of graduating.
With strong gains in every sector, the Hang Seng Index (HSI) hit its highest point in four months.
Concurrently, US futures experienced a significant increase ahead of forthcoming economic data, such as each week's unemployed claims, ultimate Q2 GDP numbers, and the PCE index, following Wall Street's S&P 500 and Dow Jones' lower immediately closing.
Why is HK50 Moving Higher?
Following a Politburo conference on economic conditions, state media reported that China will increase counter-cyclical monetary and fiscal adjustments and work to accomplish full-year targets for social and economic growth. This news caused shares to rise sharply.
Additionally, markets gained momentum following a Bloomberg News report that quoted anonymous sources and stated that Beijing was thinking of giving its largest government-owned banks a capital infusion of up to $1 trillion yuan ($142.48 billion) to strengthen their ability to support the faltering economy.
Analysts Opinion On HK50
In an advisory to clients, UBS investment bank analysts suggested that bearish shareholders cover their short positions and take a neutral stance on the market or proceed long through share options.
In a note, Goldman Sachs stated that it primarily observed long-only resources and hedge funds operating, with the flows going into the financial and consumer discretionary sectors—two of Thursday's top performers.
Hang Seng Index (HK50) Technical Analysis
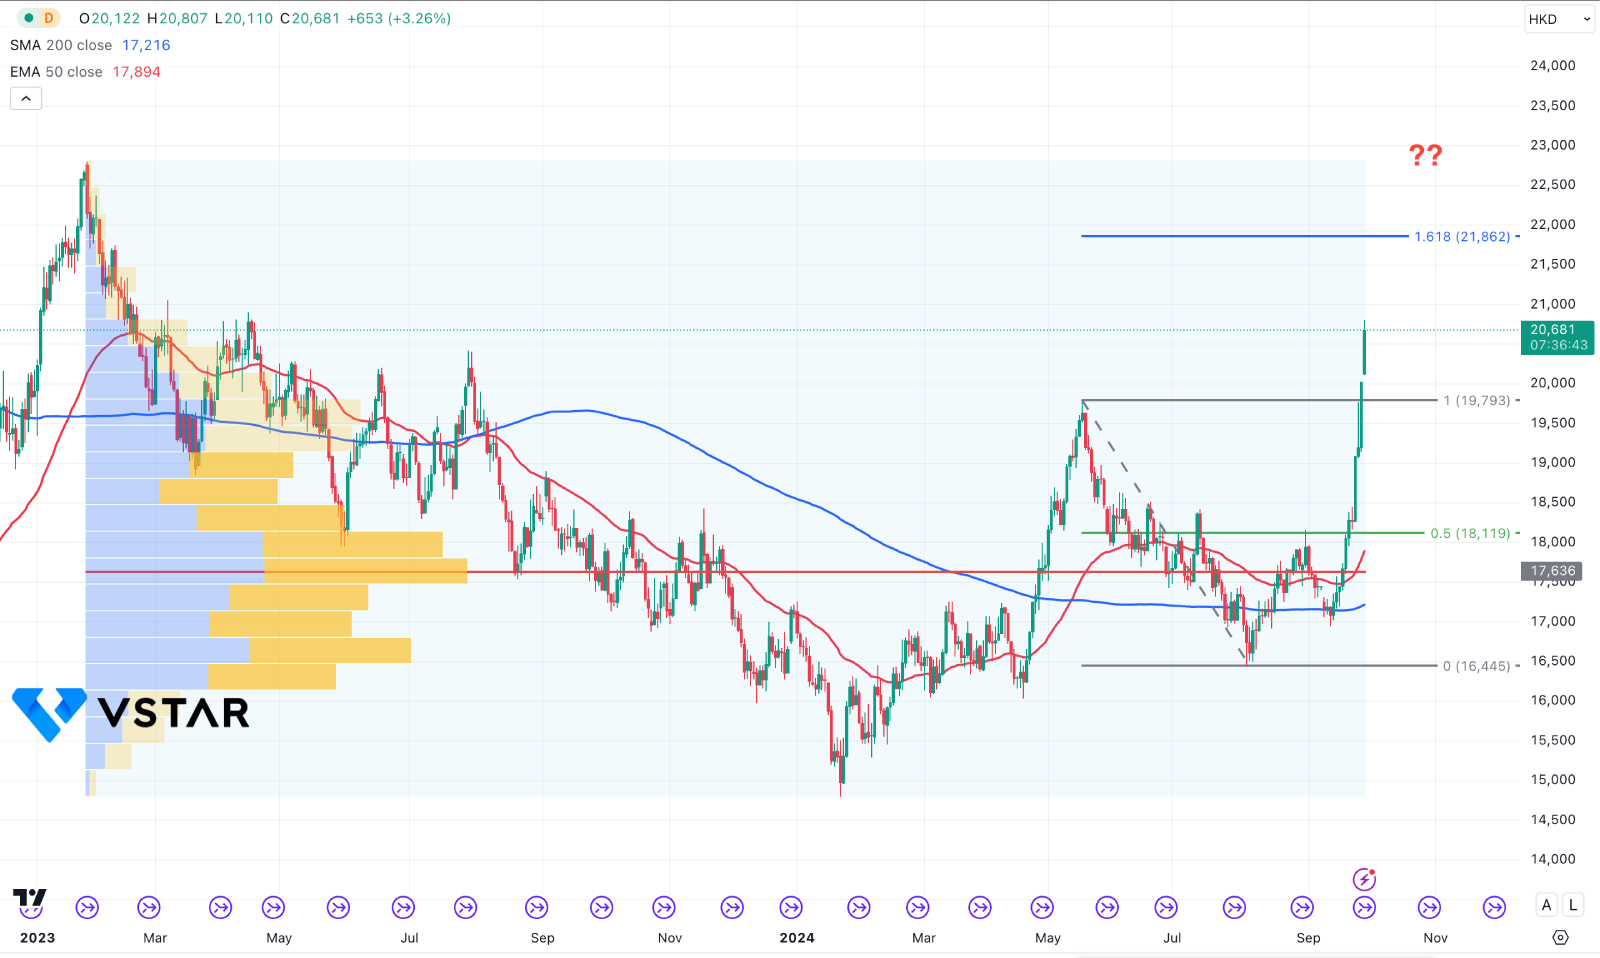
In the daily chart of HK50, a massive buying pressure is seen taking the price to a multi-month high. Primarily, a bullish breakout has initiated a trend change, supporting buyers momentum.
In the main chart, the price moved higher above the dynamic 200-day Simple Moving Average line, while the 50-day EMA is below the current price. Also, a Golden Cross is formed, from which a continuation strategy could signal a trend continuation.
Moreover, a bullish breakout from the high volume line is seen, suggesting a confluence buying pressure.
In the most recent price, a bullish daily candle is seen above the 20 May high, and investors should monitor how the price holds the buying pressure. Any immediate rebound with a bearish daily close below the 19793.00 level could lower the price towards the 18119.00 level before forming a bullish signal.
On the other hand, an immediate bullish continuation is possible, where the primary target would be the 161.8% Fibonacci Extension level, which is at the 21862.00 level. A bullish range formation at the current price could signal a strong continuation signal, opening the room for reaching the 24000.00 level.
