Thursday saw a slight decrease in Dow Jones, creating a limit to the Trump move. October statistics showed consumer costs increasing as anticipated, supporting predictions that the United States Federal Reserve would lower the rate of interest in December.
The US CPI Outlook
According to the Bureau of Labor Department of Labor Statistics, October's consumer price index (CPI) increased by 0.2% for the fourth consecutive month and by 2.6% annually. With the uncertain energy and food elements removed, the CPI grew by 0.3% in October, which was in line with economists' predictions.
Following the news release, traders' bets showed a more than 82% chance of a 25 basis-point rate of interest reduction at the Fed's conference in December, a rise from 58.7% on Monday, based on the CME group's FedWatch tool.
Despite the more careful tone of some Fed officials on Wednesday, Neel Kashkari, president of the Minneapolis Federal Reserve, informed that he was certain price inflation was on the decline and that the Consumer Price Index (CPI) data "confirms" that trend.
Is The Trump Rally Over?
After the data was released, investors turned their attention to more stable objectives, such as the possibility that newly elected President Donald Trump's regulations could worsen inflation. The standard 10-year yield, US10Y, recovered and reached 4.46%.
The stock market rally found a limit from Monday’s high, signaling a fade to the Trump bump. Also, indexes were pushed down because of the fear that the Fed might lower the interest rate on the upcoming decision date.
The main move came after the release of the PPI data, which showed a 0.2% increase, matching analysts' expectations.
Now investors are looking at how Donald Trump’s victory can maintain the stock rally as most of the indexes are at record highs.
Dow Jones (US30) Technical Analysis
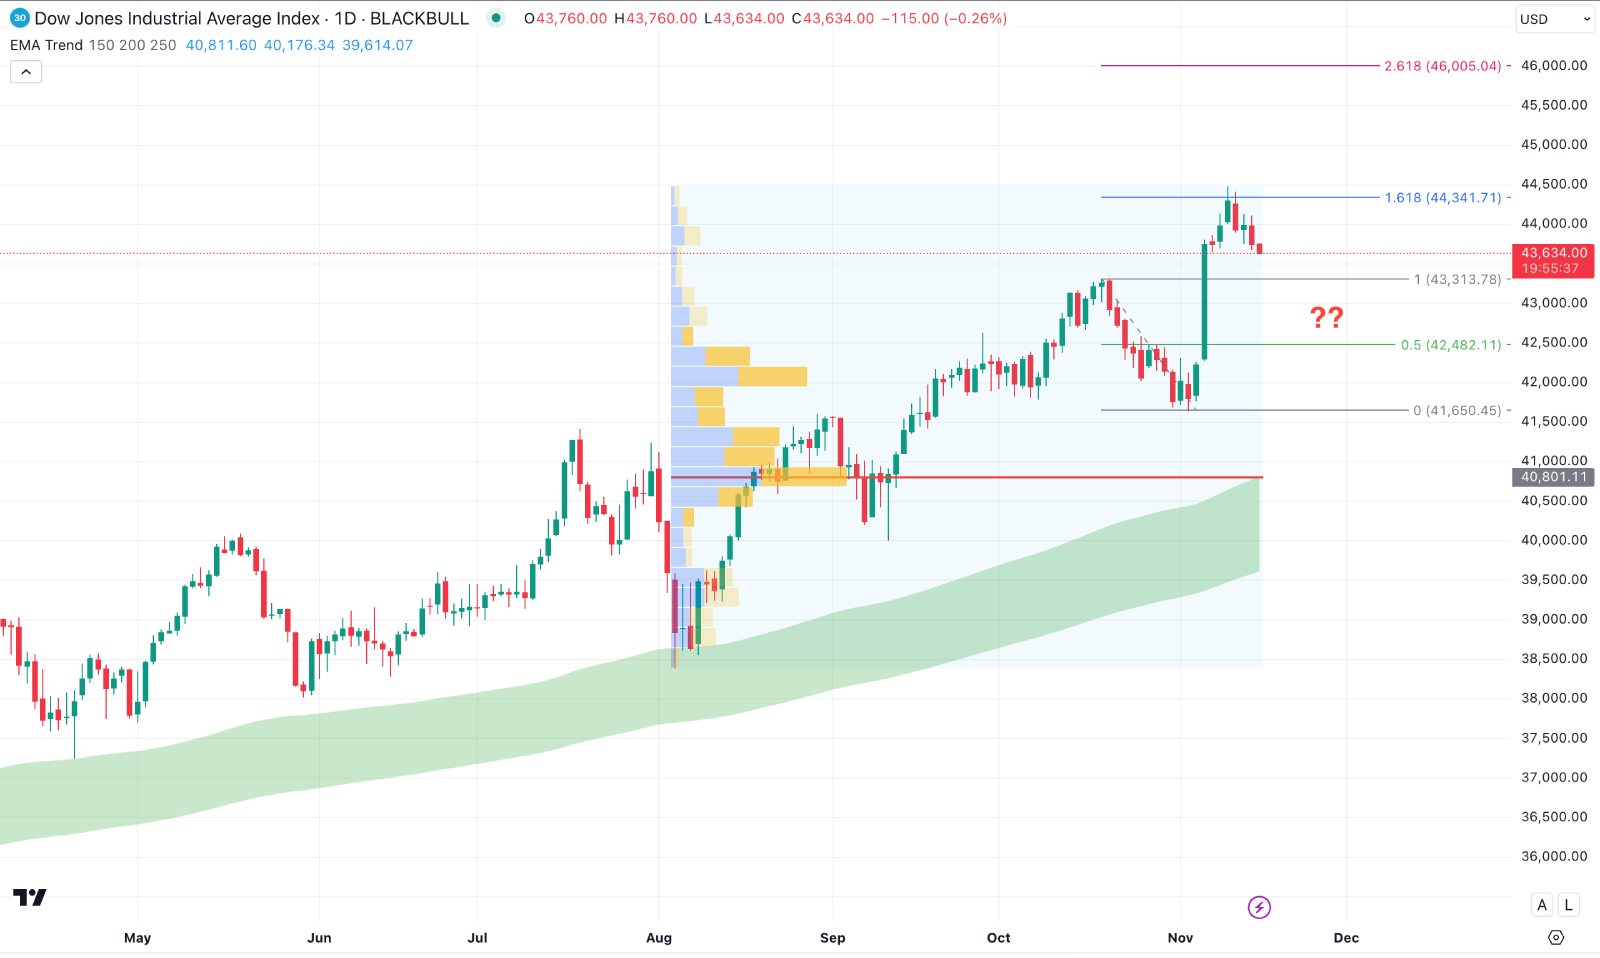
In the daily chart of US30, a prolonged bullish trend is visible, where the current price is hovering at a record high level. Despite a minor selling pressure at the top, there is no sign of a trend reversal due to the lack of momentum.

In the volume structure, the highest activity level since the August 2024 bottom is below the current price. Moreover, the Moving Average Wave, which consists of MA 150 to 250, is also below the current price, working as a major support.
Based on the daily market outlook for US 30, a minor downside pressure might come as the price found resistance from the 161.8% Fibonacci Extension level. In that case, investors should monitor how the price trades at the 43313.78 level as a failure to hold the price above this could be a challenging factor to bulls. A bearish daily candle below this line might extend the ongoing selling pressure and find a support from the 41650.45 level.
On the other hand, any valid bullish rebound from the 43000.00 to 41500.00 area with a bullish candlestick formation might extend the trend above the 45000.00 psychological level.


