


Investors eagerly anticipate the release of Bank of America's forthcoming earnings report on July 16, 2024. The ongoing market outlook is already bullish, so any upbeat result could be positive.
BAC Outlook: Earnings Projection
The company's anticipated earnings per share (EPS) are $0.79, representing a 10.23% decline from last year's quarter. Furthermore, the consensus revenue estimate is $25.19 billion, representing a minor decrease of 0.05% from the same quarter in the previous year.
According to analysts' projections, earnings per share could be $3.22, with revenue of $101.81 billion for the entire fiscal year. The actual result could represent a -5.85% and +3.28% increase from the previous year.
Investors should closely monitor Bank of America's recent analyst estimates, as these revisions frequently suggest that short-term business trends are evolving. Upward revisions to the organization's estimates may indicate optimism regarding its future performance.
BAC Key Metrics Analysis
Bank of America's Forward P/E ratio is 12.97, which is higher than the industry average of 11.62. This suggests that the company is trading at a premium compared to its peers.
Furthermore, Bank of America's PEG ratio of 1.59, a metric that considers the expected earnings growth rate, is consistent with the average PEG ratio for the Banks - Major Regional industry, which was also 1.59.
Moreover, the current ratio has remained at the 1.00 level for the last few quarters, which represents a moderate strength. The debt-to-equity ratio was in a good position, while the return on assets is on the positive side of 0.77.
BAC Stock Forecast Technical Analysis
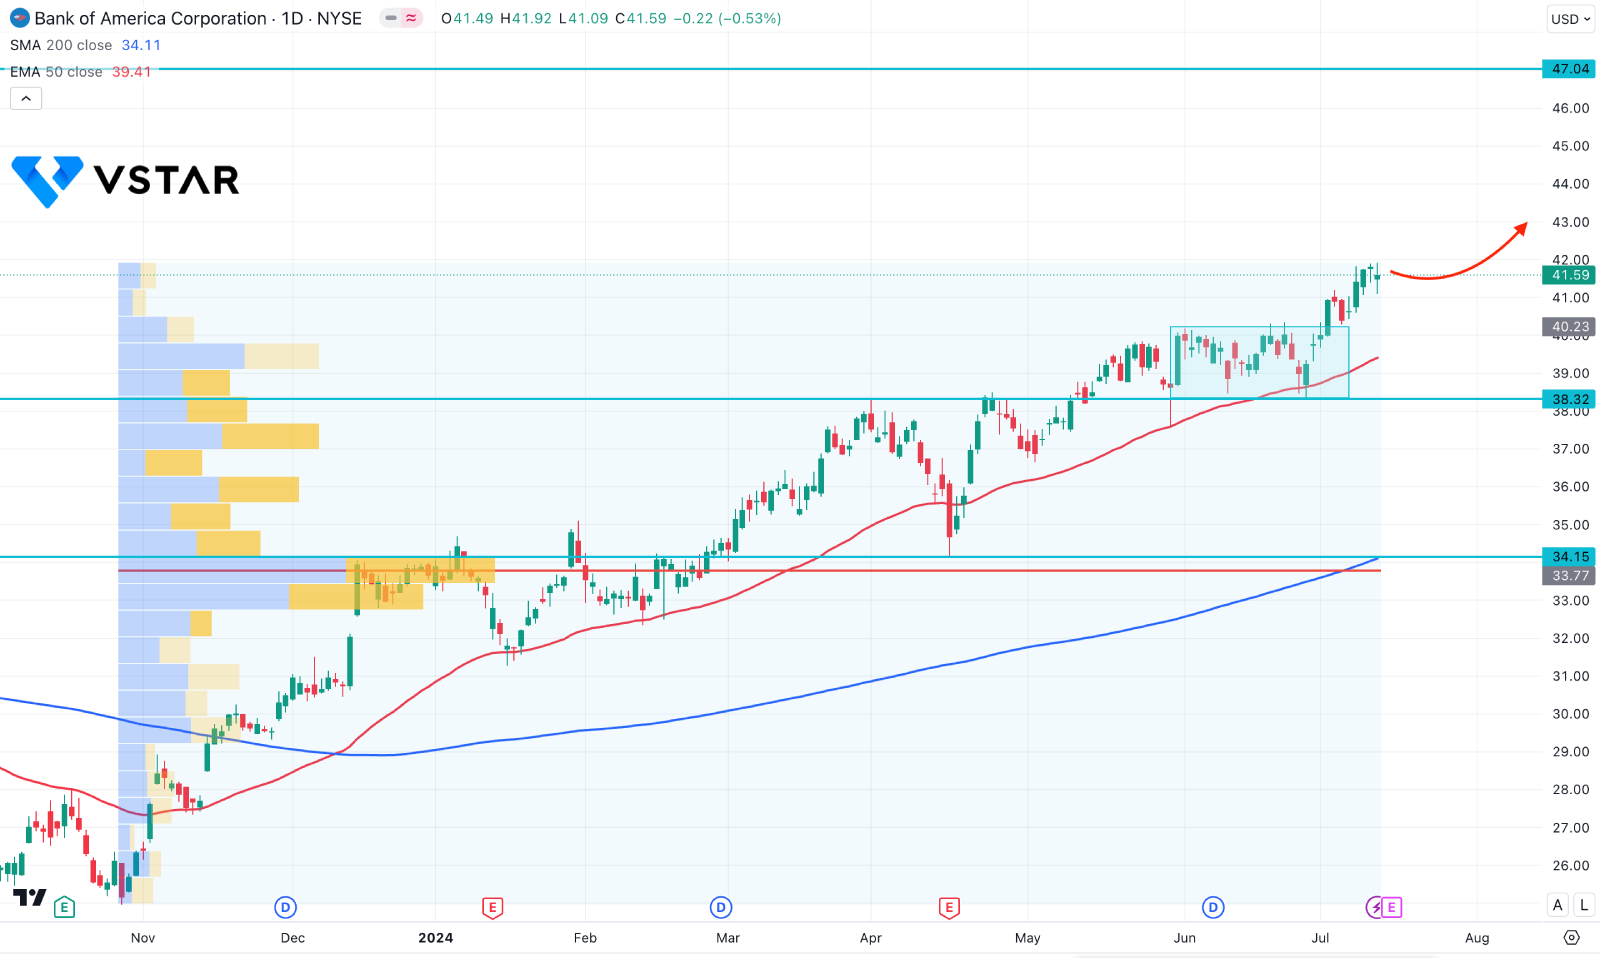
Based on the daily outlook of BAC stock price, the ongoing bullish momentum is active, suggesting a possibility for continuation. In that case, investors should monitor how the recent price trades as a corrective downside correction could open a buying possibility.
In the major structure, the dynamic 200-day Simple Moving Average is the major support, aimed higher at the high volume level of 33.77. Moreover, the 50-day Exponential Moving Average is the immediate support above the bullish rectangle pattern breakout.
Based on this outlook, a bullish surge is highly possible as long as the price trades above the dynamic 50-day EMA support. On the bullish side, the immediate resistance is visible at the 47.00 level, which could be the primary target.
On the bearish side, a bearish exhaustion with a daily candle below the 38.32 support level could lower the price toward the 34.15 support level.